R: Pie Chart
I. Constructing a Basic Pie Chart
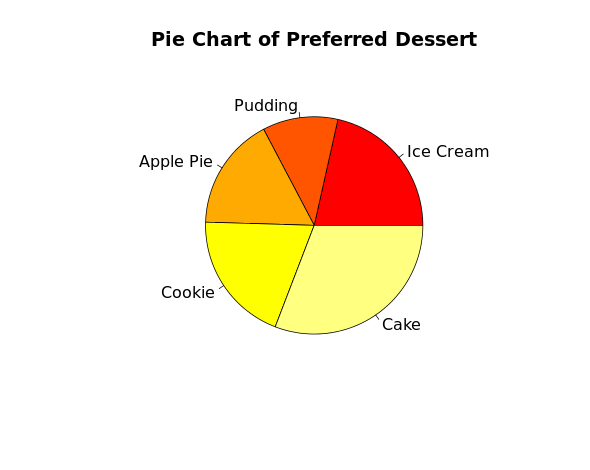
The following data, regarding their preferred dessert, was collected from patrons at a local restaurant.
| Preferred Dessert | Ice Cream | Pudding | Apple Pie | Cookie | Cake |
| Count | 23 | 12 | 18 | 21 | 33 |
The following R code will use the pie() function to construct a pie chart for this data.
# SIMPLE PIE CHART
slices = c(23, 12,18, 21, 33)

# DEFINE LABELS - ORDER IS CORRELATED TO NUMBERS ABOVE
dessert = c("Ice Cream", "Pudding", "Apple Pie", "Cookie", "Cake")

# CONSTRUCT PIE GRAPH
pie(x = slices,
    col = heat.colors(5),
    labels = dessert,
    main="Pie Chart of Preferred Dessert")

This work is licensed under a Creative Commons Attribution-NonCommercial-ShareAlike 4.0 International License.