Biased and Unbiased Estimators
Introduction
The bias of an estimator is concerned with the accuracy of the estimate.
An unbiased estimate means that the estimator is equal to the true value within the population (x̄=µ or p̂=p).
Bias in a Sampling Distribution
Within a sampling distribution the bias is determined by the center of the sampling distribution.
Thus, the sample proportion (p̂) and the sample mean (x̅) are both unbiased estimators because they are centered around parameters.
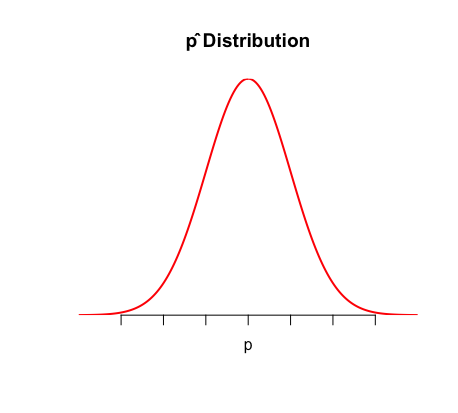
Recall that p̂ ~ N (p, \(\sqrt {pq\over n}\)). This means that the distribution is centered around p, the population proportion, and is hence unbiased.
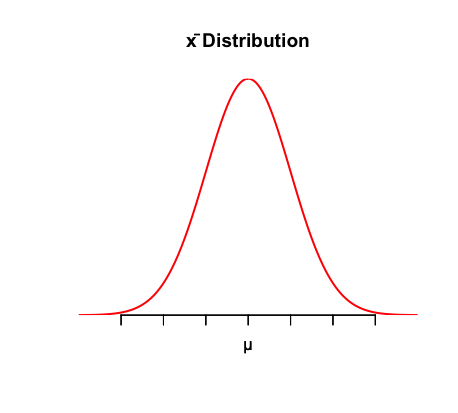
Recall that x̅ ~ N (μ, \(\sigma \over \sqrt {n}\) ). This means that the distribution is centered around μ, the population mean, and is hence unbiased.
This sampling bias allows us to describe bias more precisely by looking at the bias of estimate, rather than the sampling method. We can focus on analyzing its variability.
Variability of a Statistic
The variability of a statistic is described by the spread of its sampling distribution: the larger the sample, the smaller the spread of the distribution. In other words, variability is lower for larger sample sizes.
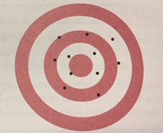
Use this visual to better understand bias and variability:
 |
 |
|
High bias, low variability
|
Low bias, high variability
|
 |
 |
|
High bias, high variability
|
Low bias, low variability *this is the ideal scenario |