Describing Distributions
Overview
When describing or comparing distributions, it is important to discuss the following characteristics: shape, center, spread, and outliers.
1. Shape
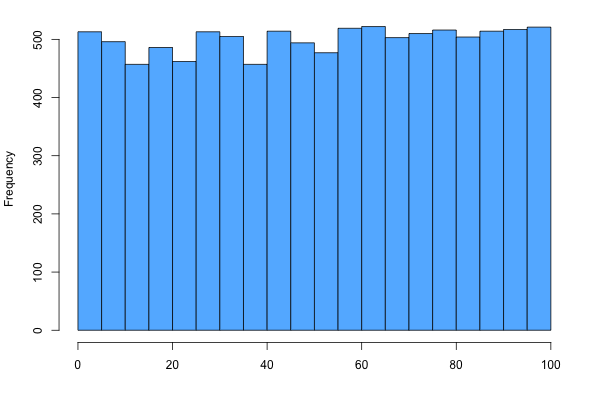
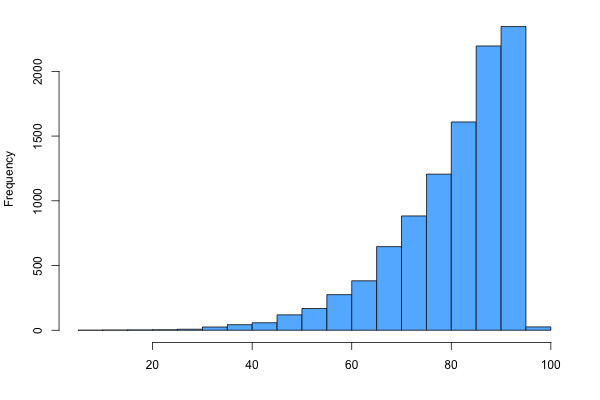
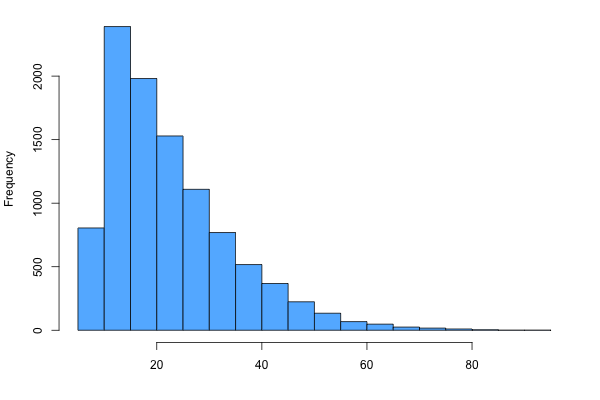
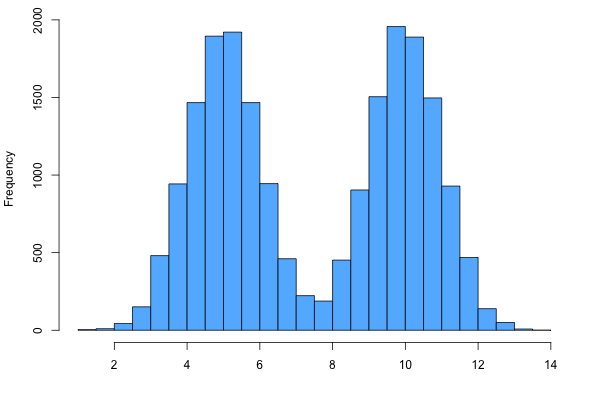
There are five main possible shapes for the distribution, as shown below. If the distribution is not symmetric, decide whether it is skewed right or left using the following rule:
For example, if the data were concentrated on the left side, leaving a tail to the right, then one would conclude that the distribution is skewed right.
| SYMMETRIC (Bell Shaped) | SYMMETRIC (Uniform) |
 |
 |
| SKEWED LEFT | SKEWED RIGHT |
 |
 |
| SYMMETRIC, BIMODAL | |
 |
2. Center
There are three measurements of center that can be used for this purpose, listed in order from most common to least common.
A) Median: The median is the value that splits the data in half so that 50% of the data lies to the left and 50% lies to the right.
- Notation: μ
- If the sample size is odd, take the middle number. If the sample size is even, take the average of the two middle numbers.
- The median is the most frequently used measure of center for describing distributions.
B) Mean: The mean is the average value.
- Notation: x̅
- The mean is calculated by summing all the values together and then dividing this by the total number of data points.
C) Mode: The mode is the most frequently observed value in the data set.
- The mode is rarely used when describing distributions.
*For more information on measures of center, see the 'Measures of Center' help page.
3. Spread
There are three measurements of spread that can be used for this purpose.
A) Range: The range is the difference between the minimum and maxiumum values.
- Stating the minimum and maximum values is the most common way to describe the spread of distributions, especially when you are not given the dataset itself and must estimate through visual inspection of the graph.
B) Standard Deviation: Standard deviation measures the amount of dispersion from the mean.
- Formula: Sx = \(\sqrt{Σ( x_i - \bar{x} )^2 \over n-1 }\)
- Nonresistant (best used for symmetric data)
C) Interquartile Range (IQR): The IQR measures the difference between the first and third quartiles.
- Formula: IQR = Q3 - Q1
- Resistant (works with data that is skewed and/or has outliers)
*For more information on IQR & quartiles, see the 'Five Number Summary' help page.
4. Outliers
Outliers are the extreme values in the data set. They can be estimated through visual inspection or calculated using the following formulas:
Any values below the lower threshold or above the upper threshold can be considered outliers.
*For more information on IQR & quartiles, see the 'Five Number Summary' help page.