Intro to RStudio
What is R?
R is a programming language focused mainly on statistics computing and creating graphics. This software is useful for analyzing sets of data, constructing representations of data, and modelling statistics.
Why R?
-
IT’S FREE: Anyone can use it, and it’s especially popular among college students and professors studying statistics. Even employers use R - it’s the highest paid technical skill to have (http://www.econometricsbysimulation.com/2014/03/why-use-r-five-reasons.html).
-
IT’S FLEXIBLE: Stats-wise, the language R can do basically anything you want it to do. Nearly all the data analysis tools you’ll need are built right into the language, and it’s easy to adapt your code to extract the exact information you’re looking for.
-
IT’S POPULAR: R has become one of the most commonly used computing languages in the statistics community, so it’s always up to date with the latest stats and analysis methods. This also means that there are tons of blogs and websites (including this one) that can help you learn new skills and solve any issues you might have.
-
IT’S POWERFUL: Since R has so many users, as a language it has been highly developed and is very well supported. It can easily handle huge amounts of data and complex simulations.
Getting Started with R

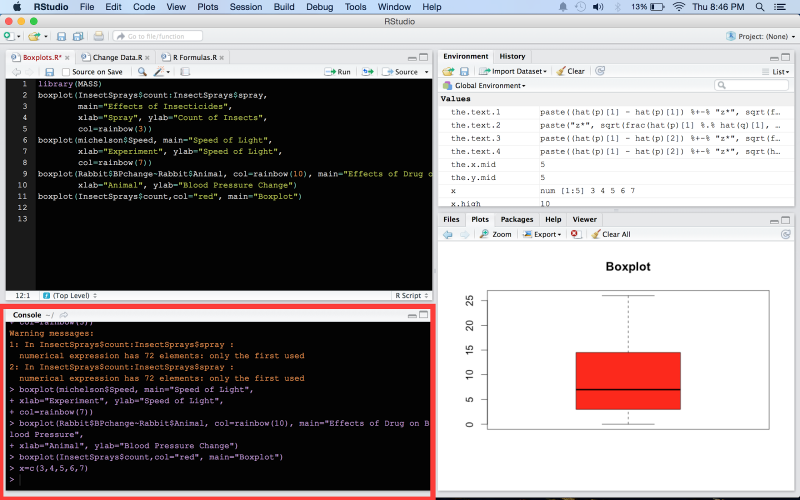
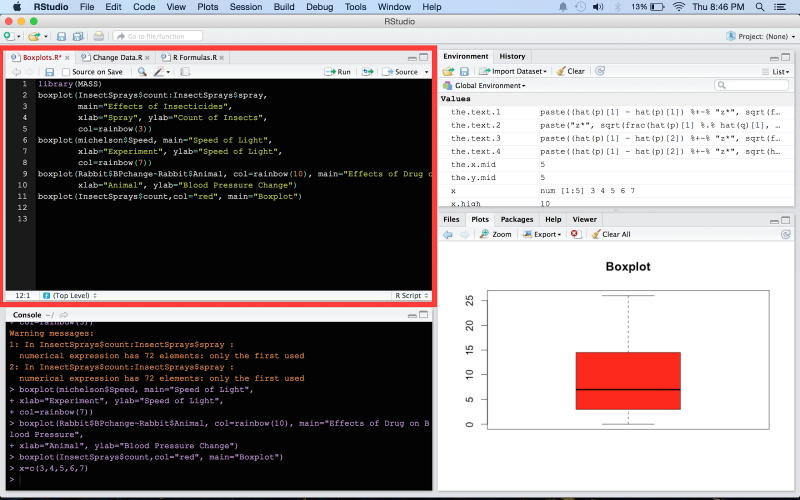
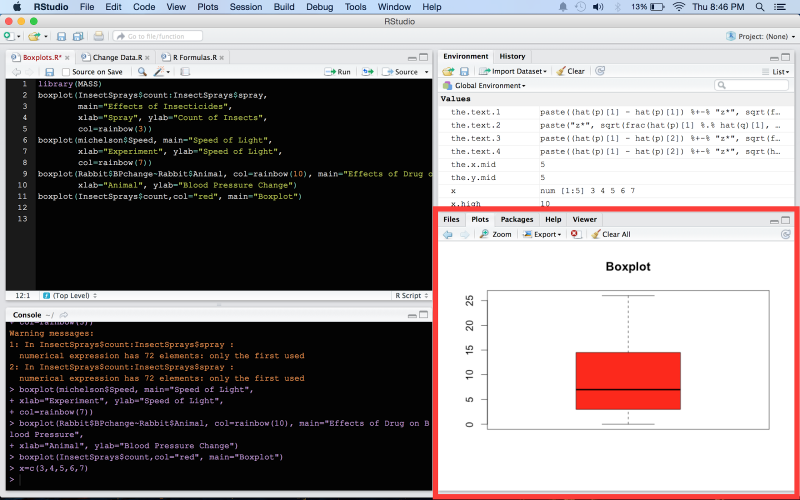
LAYOUT OF R
R has different areas/boxes designated for different functions
|
Console
|
|
|
Source
|
|
|
Environment/History
|
|
|
Files/Plots/Packages/Help/Viewer
|
|

Personalizing Your RStudio
You can change the way your RStudio works by selecting:
Tools > Global Options > Appearance
-
Editor font changes the font that RStudio appears in
-
Editor theme changes the color of the boxes where you type your code in (Source and Console)
You can also easily adjust which boxes are showing and which boxes are larger or smaller in your Rstudio by minimizing or maximizing each box.
Basics Operations of R
|
Code |
Description |
|
?function OR help(function) |
Gives information on any unknown function or dataset |
|
summary(x) |
Gives a statistical summary of any dataset “x” |
|
1+2 7-5 8*4 36/12 |
Simple addition, subtraction, multiplication, division |
|
2^3 |
Exponents |
|
sqrt(16) |
Square root |
|
exp(2) |
e2 |
|
pi |
Pi: 3.14159… |
NOTE: NaN means not a number