Introduction to Hypothesis Testing
I. What is Hypothesis Testing?
Hypothesis testing is a statisticians equivalent to a court case. Your objective is to validate or disprove a particular statistical claim, by proceeding as if the claim is true and then seeing how likely or unlikely that would be. Similarly, in a court case you are innocent until proven guilty.
More formally, hypothesis testing is a process in which you establish an alternative hypothesis to the given or "null" hypothesis, and then calculate the probability of observing a sample statistic as extreme or more extreme to the one in your sample. If the likelihood is extremely low, your results will be statistically significant and you will reject the null hypothesis. For more information on what those terms mean, proceed below ↓
II. Definitions of Key Terms
Null Hypothesis (\(H_0\))
The null hypothesis is the given fact. You are trying to disprove the null hypothesis.
Alternative Hypothesis (\(H_A\))
The alternative hypothesis is what you are trying to prove instead of the null.
Test Statistic (z or t)
The test statistic is calculated with a formula using the data given to you in the problem. You use the test statistic to find a p-value (see below).
Recall that hypothesis testing is when you find the probability of observing a sample statistic as extreme or more extreme to the one in your sample. Thus, it follows that if the test statistic is negative, the test is left-sided (the more extreme values lie further to the left). If it is positive, the test is right sided (the more extreme values lie further to the right).
P-Value
The p-value is the probability of obtaining a statistic as extreme or more extreme than the one observed in the experiment.
It is important to remember that the p-value is computed by assuming that the null hypothesis is true. Thus, the lower the p-value, the stronger the evidence that the null hypothesis is false. In other words, the lower the p-value the stronger the evidence to support the alternative hypothesis.
Significance Level (\(\alpha\))
As stated above, the lower the p-value, the stronger the evidence to support the alternative hypothesis. However, this begs the question: what p-value is low enough to actually support the alternative hypothesis? Is a p-value of 0.35 low enough? How about 0.01? This is where the significance level comes into play.
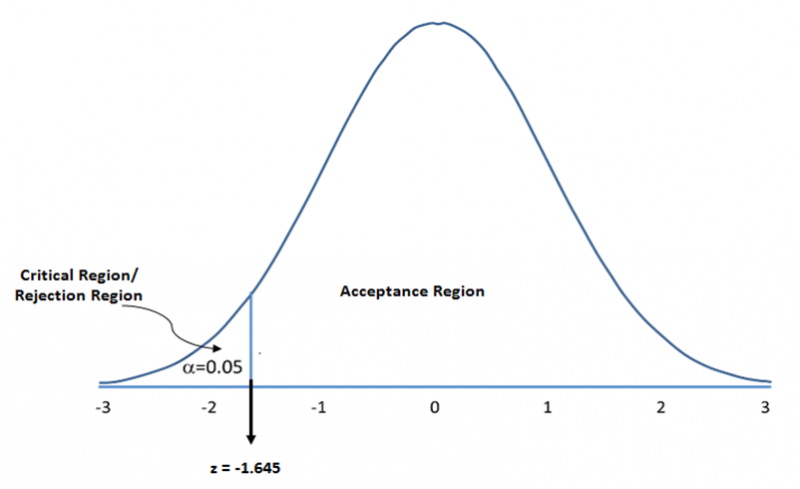
The signficance level is a predetermined threshold at which you can reject the null. Typically, the null hypothesis is rejected if the probability value is below 0.05. The visual below shows what it would look like to reject the null for a left-sided test at \(\alpha = 0.05\) :
III. Steps to Hypothesis Testing:
Step 1: Name Test
- One Proportion, One Sample Mean, etc.
Step 2: Define Test
- Null Hypothesis (\(H_0\)): the statistical claim → p = #
- Alternative Hypothesis (\(H_A\)): what you wish to prove
- possible alternative claims: p > #, p < #, and p ≠ # (# is same as in H0)
Step 3: Assume \(H_0\) is true and define its normal distribution. Then check for specific conditions which vary depending on the type of hypothesis test.
Step 4: Using the normal distribution, calculate the test statistics and p-value.
Step 5: Analyze your results and determine if they are statistically significant.
- statistically significant means that the p-value is below the significance level (\(\alpha\)) given in the problem (assumed to be 5% or \(\alpha\)=.05 if not specified)
- If the results are statistically significant we can reject the null hypothesis in favor of the alternative hypothesis.
- Note we either reject the null hypothesis in favor of the alternative hypothesis or fail to reject the null hypothesis. We can not prove the null hypothesis to be true.
- Reject: "We calculated a p-value of ___. This p-value is less than the assumed significance level of 0.05. Therefore, we REJECT the null hypothesis. The data SUPPORTS the claim that (insert description of the alternative hypothesis) ."
- Fail to reject: "We calculated a p-value of ___. This p-value is greater than the assumed significance level of 0.05. Therefore, we FAIL to reject the null hypothesis. The data does NOT support the claim that (insert description of the alternative hypothesis) ."
IV. Example
As an attempt to save money for college, you gamble your life savings on a game that involves flipping a coin. You continue to bet on tails, but realize that the coin is landing an abnormally many times on heads. They will not let you touch the coin, but they flip it in front of you 100 times while you record the outcomes. You find that the coin only lands on tails 38 times. Test this hypothesis at the 5% significance level (\(\alpha\)=.05).
Step 1: Name Test
In this case, this will be a One Proportion Hypothesis Test.
Step 2: Define Test
\(H_0\): It is a fair coin and would land on tails exactly half of the time → p=.50
\(H_A\): It is not a fair coin and lands on tails less than half of the time → p < .50
p̂ = \(38 \over 100\)= .38
Step 3: Assume \(H_0\) is true and define its normal distribution. Then check the conditions.
Assuming the null hypothesis is true → p = .50
σp = \(\sqrt{p(1-p) \over n}\)= \(\sqrt{(.5)(1-.5) \over 100}\)= .05
N(.5, .05)
In this case, the conditions are all met. For more on the conditions of this test, see the page on One Proportion Hypothesis Testing.
Step 4: Using the normal distribution, calculate the test statistic and p-value
test statistic: z= \(p̂-p \over σ\)= \(.38-.5 \over .05\) = -2.4
p-value (from z table) = .0082
Step 5: Analyze your results and determine if they are statistically significant.
Since the p-value is below the significance level of \(\alpha\)=.05 stated in the problem, we can say that the results are statistically significant. Therefore, we reject the null hypothesis in favor of the alternative hypothesis.
We have found significant evidence to suggest that the coin is indeed not fair and you are being cheated out of your money.
V. Recap
Remember these important facts:
- In hypothesis testing, YOU ASSUME THAT THE NULL IS TRUE and paint a picture as if that's the case.
- If the p-value is very LOW (below the significance level), then the null is rejected and you can conclude that the data supports the alternative hypothesis.
- Always NAME the test, DEFINE the test, check the CONDITIONS, calculate the TEST STATISTIC, find the P-VALUE, and then form a CONCLUSION.
Links to Specific Hypothesis Testing Pages: