Linear Regression: what is the Least Squares Regression Line, and what does it have to do with Residuals?
Introduction
Imagine you have a scatterplot full of points, and you want to draw the line which will best fit your data. This best line is the Least Squares Regression Line (abbreviated as LSRL).
General LSRL Formula
This is true where \(\widehat{y} \) is the predicted y-value given x, \(a\) is the y intercept, \(b\) and is the slope.
The Least Squares Regression Line Predicts \(\widehat{y} \)
For every x-value, the Least Squares Regression Line makes a predicted y-value that is close to the observed y-value, but usually slightly off. This predicted y-value is called "y-hat" and symbolized as \(\widehat{y} \). The observed y-value is merely called "y."
Residuals
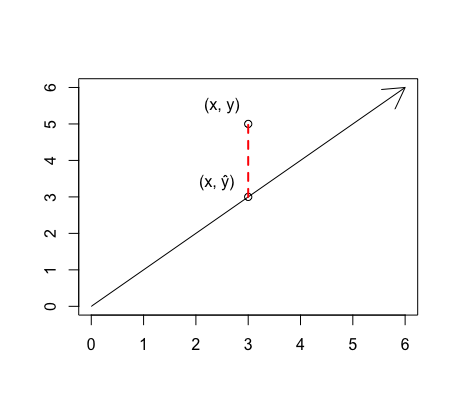
Let's take a moment to notice the little gap between the observed y-value (the scatter point labelled y) and the predicted y-value (the point on the line labelled \(\widehat{y} \)). This gap is called the residual. The full definition and formula are below:
** REMEMBER: the residual is observed minus predicted!!
For more information on residuals, click here.
The LSRL and Residuals
By now, you know that the Least Squares Regression Line goes through a scatterplot of points and predicts a y-value (\(\widehat{y} \)) for any given x. You also know that the goal here is to create the best fitting line possible. This is where residuals come into play. The LSRL fits "best" because it reduces the residuals.
In other words, for any other line other than the LSRL, the sum of the residuals squared will be greater. This is what makes the LSRL the sole best-fitting line.
Calculating the Least Squares Regression Line
When given all of the data points, you can use your calculator to find the LSRL.
Step 1: Go to STAT, and click EDIT. Then enter all of the data points into lists 1 and 2.
Step 2: Go to STAT, and click right to CALC. Then hit LinReg. Hitting enter and running this function will give you the slope and y-intercept of your LSRL as well as the r and r2 values.
When you do not have the data points, there is a way to calculate the LSRL by hand. There are two key facts you need to know:
(1) The LSRL must pass through \(( \bar{x}, \bar{y} )\).
(2) The slope of the LSRL (which, when using the formula \(\widehat{y} = a + bx\), would be \(b\)) is calculated as follows: \(b = (r) ({s_y \over s_x} )\)
Using this information, you can find the LSRL as shown in the example below:
|
Given the table to the right, find the equation for the Least Squares Regression Line. |
|
Step 1: Find the Slope
\(b = (r) ({s_y \over s_x} )\)
\(b = (0.82) ({17 \over 12} )\)
\(b = 1.16\)
Step 2: Find the y-intercept
\(\widehat{y} = a + bx\)
\(33 = a + (1.16)(28)\)
\(a = 0.52\)
Step 3: Put it all together!
\(\widehat{y} = a + bx\)
\(\widehat{y} = 0.52 + 1.16x\)
Conclusion
- The Least Squares Regression Line is the line that minimizes the sum of the residuals squared.
- The residual is the vertical distance between the observed point and the predicted point, and it is calculated by subtracting \(\widehat{y} \) from y.