Measures of Center - Mean, Median, Mode
Introduction
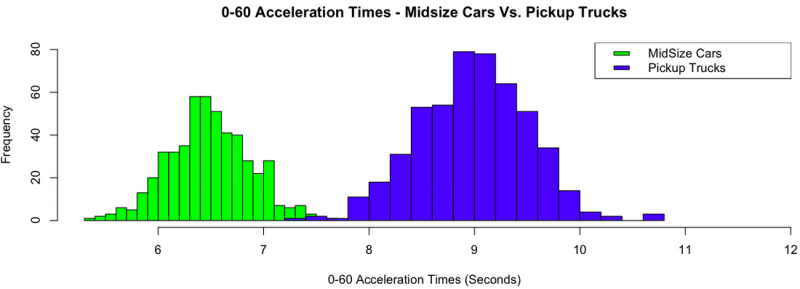
When analyzing a data set, one of the first things one often wishes to know is where the center of the distribution lies. For example, the graphic below compares 0-60 acceleration times for midsize cars with that of pickup trucks. If we wished to compare the two distributions, one important measure to compare would be the centers. In other words, where does the center of the midsize distribution lie, and how does this compare with the center of the pickup distribution? From the graphic below, it is obvious that the midsize cars accelerate faster than pickup trucks, but how can we compare the centers of the distributions numerically? In this help page, you will be presented with three numerical measures of center: mean, median, and mode. Mean and median are most commonly used to determine the center of a distribution, and will thus be emphasized more.
Mean
Know as "the average," it is calculated by summing all the data values and dividing by the total number of values in the data set. The sample mean is represented by \(\bar{x}\), and is called "x-bar". The formula for the sample mean is shown below:
Mean Formula
\(\overline{x}\: =\: \frac{\sum x}{n}\)
Median
The median is the value that splits the data in half, such that roughly 50% of the data lies to the left, and roughly 50% lies to the right.
To find the median, begin by ordering the data from least to greatest. Then:
a. If the sample size is odd, take the middle number.
Example: 1, 2, 3, 4, 5 ⇒ Median = 3
b. If the sample size is even, take the average of the two middle numbers.
Example: 1, 2, 3, 4, 5, 6 ⇒ Median = \(\frac{3+4}{2}\) = 3.5
Mode
The most frequently observed value in data set.
Solution:
To find the mean:
\(\overline{x}\: =\: \frac{\sum x}{n} = \frac{18+16+53+21+34+45+15+33+44}{9} = \frac{279}{9}=31\)
The mean is 31.
To find the median:
#1 Order the data from least to greatest:
15, 16, 18, 21, 33, 34, 44, 45, 53
#2 There is an odd number of numbers, thus, the median is the middle number:
15, 16, 18, 21, 33, 34, 44, 45, 53
The median is 33.
Which Measure to Use?
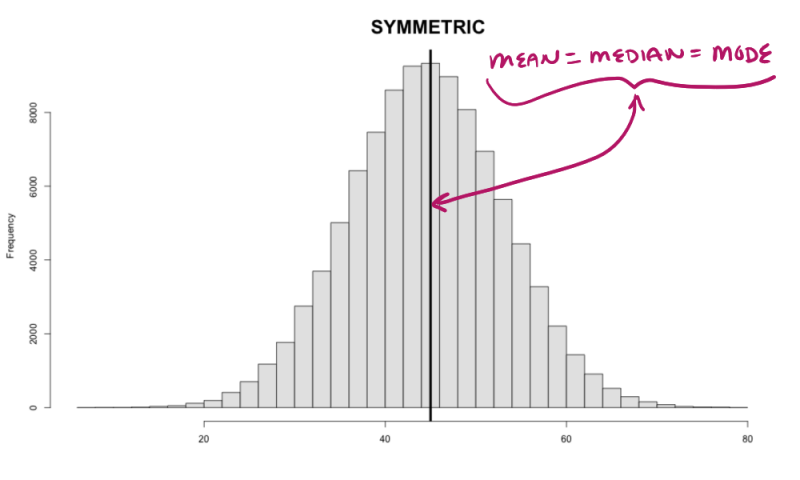
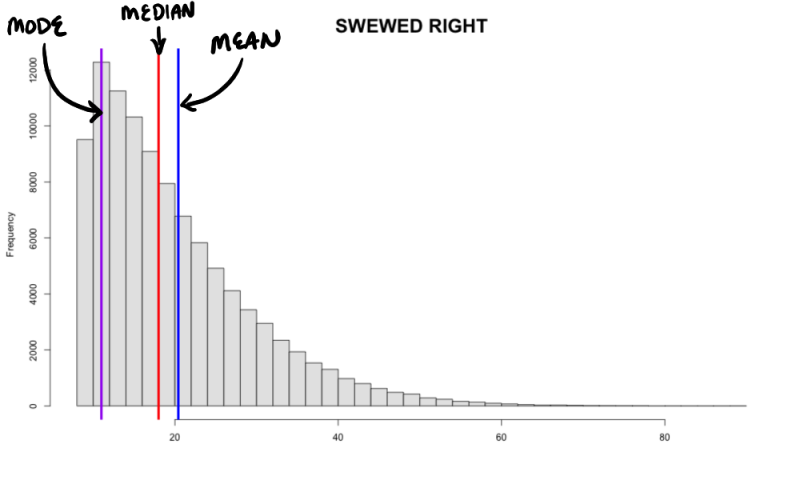
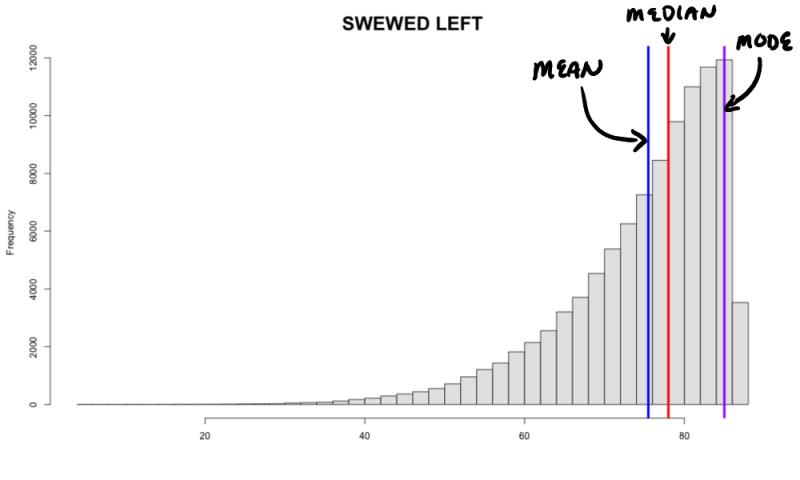
We have presented three different measures of center. Now, which one is best to use? To begin with, mean and median are the primary measures of center when describing a distribution. If a distribution is symmetric, as shown below, the mean is approximately equal to the median, and the mean is the preferred measure to use. However, if the data is skewed to the left or to the right, the mean tends to get pulled towards the tails of the distribution. We call this attribute: non-resistant. The median, on the hand, tends to be less affected by skewed data or data with outliers. Thus we call the median: resistant. When the data is skewed or has outliers, it is recommended that one use the median as the preferred measure of center.
* For more information on nonresistant vs resistant measures, see the 'Nonresistant vs Resistant' help page.
|
SYMMETRIC MEAN \(\approx\) MEDIAN |
 |
|
SKEWED RIGHT MEAN > MEDIAN |
 |
|
SKEWED LEFT MEAN < MEDIAN |
 |