Introduction to the Normal Distribution & Empirical Rule
The Normal Distribution
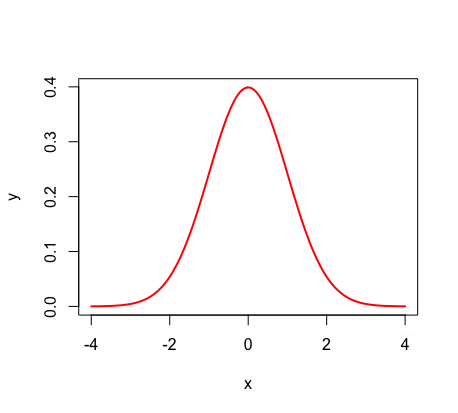
The Normal Distribution is a continuous bell shaped curve. Things such as test scores, weights, and heights can all be normally distributed.
Here are some key facts about the Normal Distribution, which is known as a Gaussian bell curve when the data is around a central value without a left or right bias:
- Usually symmetric towards the center, so 50% of the values are less than and 50% of the values greater than the mean.
-
Total area under curve= 1.
-
The data is most dense in the middle and less dense to the right and left.
-
mean=median=mode
-
Defined by mean and standard deviation:
-
mean μ -(average) expected value to measure the central tendency
-
standard deviation σ - separation used to quantify the amount of variation of a data set
-
The Empirical Rule
The Empricical Rule states that:
68% of data falls between one standard deviation of the mean (+/- σ)
95% of data falls between two standard deviations of the mean (+/- 2σ)
99.7% of data falls between three standard deviations of the mean (+/- 3σ)
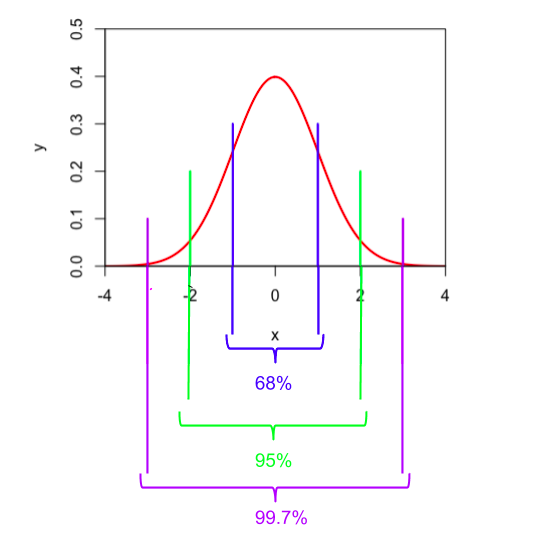
(For this distribution, the standard deviation equals one unit. In other words, σ = 1).