R: Constructing Bar Charts
I. Basic Bar Graph
To construct a bar graph, one needs to use the barplot() function in R. Lets go ahead and create a bar graph for the following data for a study on preferred method to stay connected with friends by seniors at Tulane University:
| Method | Text | Snapchat | |||
| Count | 38 | 43 | 58 | 49 | 21 |
# ENTER THE PREFERRED METHODS TO COMMUNICATE
method.names = c("Facebook", "Twitter", "Text", "Snapchat", "Whatsapp")

# ENTER THE COUNT DATA INTO R
count = c(38, 43, 58, 49, 21)

# CONSTRUCT BAR GRAPH
barplot(height = count, names.arg = method.names)
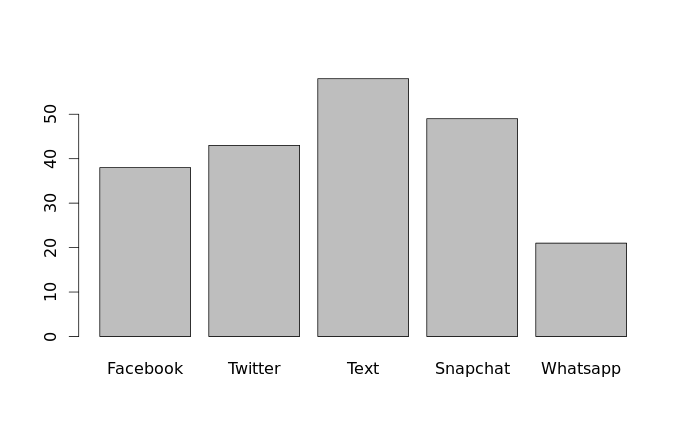
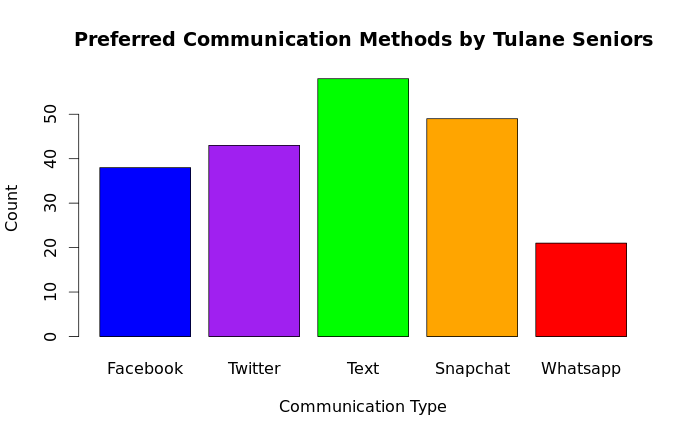
Now, let's improve the bar graph by adding some labels and color to make the graphs more understandable and presentable.
# DEFINE COLORS
colors = c("blue", "purple", "green", "orange", "red")

# CONSTRUCT BAR GRAPH WITH COLOR AND LABELS
barplot(height = count,
        names.arg = method.names,
        col = colors,
        xlab = "Communication Type",
        ylab = "Count",
        main = "Preferred Communication Methods")
II. Bar Graph From Raw Data
Lets begin by loading the PASWR library first, as mentioned above, the titanic3 dataset is found in the PASWR library. Once the library is loaded, we can then use the head() function to view just the first six rows of the dataset. Note: This dataset is relatively large, so the head() function is great when you just want to get a feel for the data, but don't want to see all of the data.
> # LOAD PASWR LIBRARY THAT CONTAINS THE titanic3 DATASET
> library(PASWR)
>
> # LARGE DATASET - LETS JUST VIEW FIRST 6 ROWS ONLY
> head(titanic3)
  pclass survived                            name    sex     age sibsp parch ticket
1    1st        1   Allen, Miss. Elisabeth Walton female 29.0000     0     0  24160
2    1st        1  Allison, Master. Hudson Trevor   male  0.9167     1     2 113781
3    1st        0    Allison, Miss. Helen Loraine female  2.0000     1     2 113781
4    1st        0 Allison, Mr. Hudson Joshua Crei   male 30.0000     1     2 113781
5    1st        0 Allison, Mrs. Hudson J C (Bessi female 25.0000     1     2 113781
6    1st        1             Anderson, Mr. Harry   male 48.0000     0     0  19952
      fare   cabin    embarked boat body                       home.dest
1 211.3375      B5 Southampton    2   NA                    St Louis, MO
2 151.5500 C22 C26 Southampton   11   NA Montreal, PQ / Chesterville, ON
3 151.5500 C22 C26 Southampton        NA Montreal, PQ / Chesterville, ON
4 151.5500 C22 C26 Southampton       135 Montreal, PQ / Chesterville, ON
5 151.5500 C22 C26 Southampton        NA Montreal, PQ / Chesterville, ON
6  26.5500     E12 Southampton    3   NA                    New York, NY
Next, lets go ahead and create a table of the pclass variable using the table() function:
> # LETS CREATE A TABLE OF plass DATA ONLY
> class.table = table(titanic3$pclass)
>
> # LETS VIEW THE TABLE TO SEE WHAT IT LOOKS LIKE
> class.table

1st 2nd 3rd
323 277 709
Once we have the table defined as t, we can then construct our bar graph using the barplot() function.
barplot(class.table)
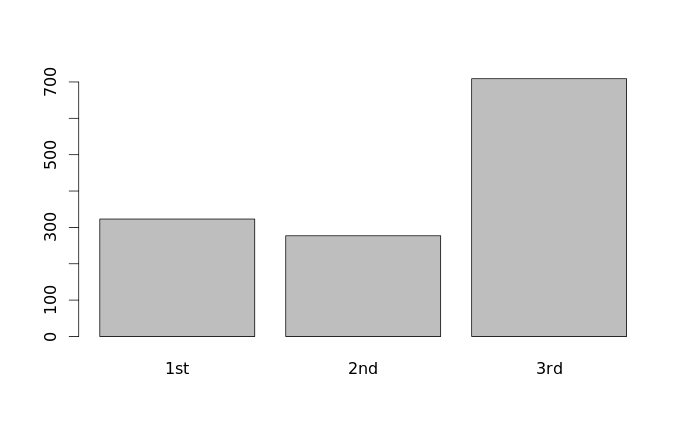
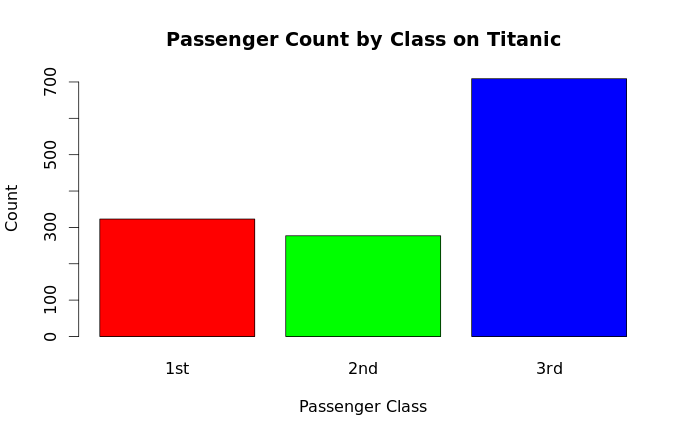
Finally, let's improve the bar graph by adding some labels and color to make the graphs more understandable and presentable.
barplot(class.table,
        main = "Passenger Count by Class on Titanic",
        xlab = "Passenger Class",
        ylab = "Count",
        col = rainbow(3))
III. Stacked Bar Chart
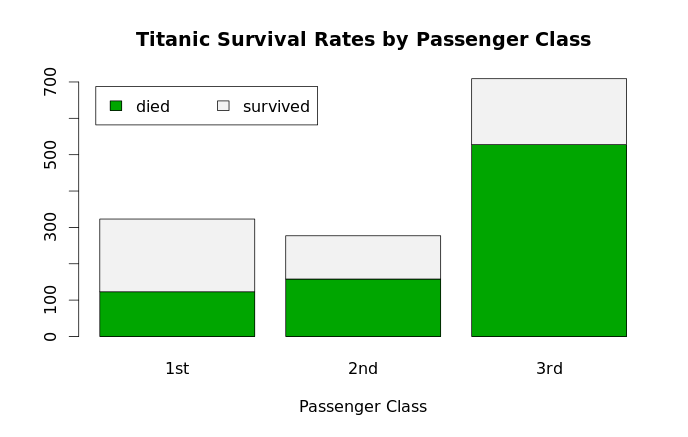
Using the titanic3 data from section II, use the following R code to construct a stacked bar chart with legend.
# STACKED BAR CHART WITH COLORS AND LEGEND
counts = table(titanic3$survived, titanic3$pclass)

# CONSTRUCT BARCHART
barplot(counts,
        main = "Titanic Survival Rates by Passenger Class",
        xlab = "Passenger Class",
        col = terrain.colors(2))

# ADD LEGEND
legend("topleft",
       inset = .03,
       legend = c("died", "survived"),
       fill = terrain.colors(2),
       horiz = TRUE)
IV. Clustered Bar Chart
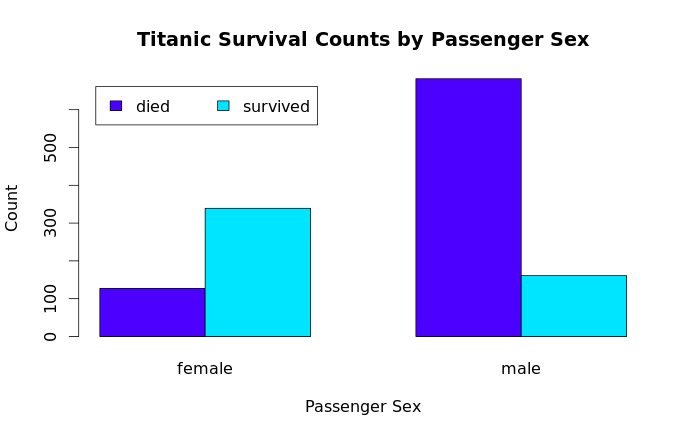
Again, using the titanic3 data from section II, we will examine the relationship between passenger sex and survival rates. Use the following R code to construct a clustered bar chart with legend. Notice how we use the argument beside = TRUE to change the barplot from a stacked barplot to a clustered barplot.
counts = table(titanic3$survived, titanic3$sex)

barplot(counts,
        main = "Titanic Survival Counts by Passenger Sex",
        xlab = "Passenger Sex",
        ylab = "Count",
        col = topo.colors(2),
        beside = TRUE)

legend("topleft",
       inset =.03,
       legend = c("died", "survived"),
       fill = topo.colors(2),
       horiz = TRUE)

This work is licensed under a Creative Commons Attribution-NonCommercial-ShareAlike 4.0 International License.
