R - Colors
R has a wide range of colors that can be applied to graphics. Use the two examples below in conjuction with the colors further below to add color to your graphics.
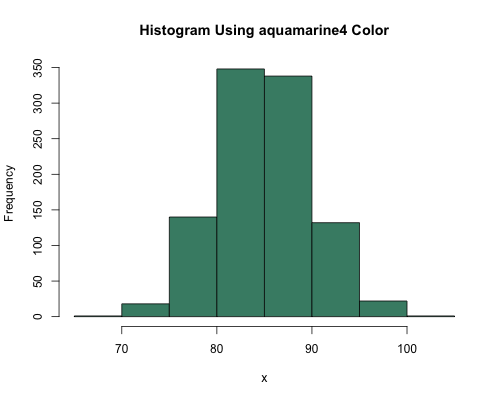
Construct a histogram using the aquamarine4 color.
### Let's create 1000 numbers randomly drawn from a population that has a
### normal distributed with a mean of 85 and standard deviation of 5
x=rnorm(1000, 85, 5)

### Create a histogram using "aquamarine4" color
hist(x,
    col="aquamarine4",
    main="Histogram Using aquamarine4 Color")
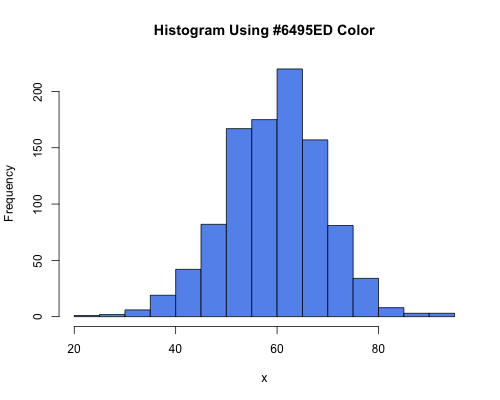
Construct a histogram using the #6495ED color.
### Let's create 1000 numbers randomly drawn from a population that has a
### normal distributed with a mean of 60 and standard deviation of 10
random.data=rnorm(1000, 60, 10)
hist(random.data,
    col="#6495ED",
    main="Histogram Using #6495ED Color")
![]()
This work is licensed under a Creative Commons Attribution-NonCommercial-ShareAlike 3.0 Unported License.