R: Matched Pairs
A fitness researcher wishes to prove the hypothesis that people who wear fitness trackers walk more when their progress is posted on social media. To prove her claim, the researcher randomly selected 10 individuals to participate in a two week study. All participants were required to wear a fitness trackers to track the number of steps
Ho: μdiff = 0
Ha: μdiff > 0
|
Steps not posted to social media |
39507 |
35280 |
48244 |
31922 |
33564 |
33545 |
31323 |
37424 |
25909 |
27857 |
|
Steps posted to social media |
38134 |
30360 |
41655 |
34478 |
34200 |
35225 |
37915 |
29449 |
40390 |
34841 |
1. Lets begin by entereing the data into R as shown below:
# Enter the steps observed when posting (np) to social media
p = c(38134, 30360, 41655, 34478, 34200, 35225, 37915, 29449, 40390, 34841)

# Enter the steps observed when not posting (np) to social media
np = c(39507, 35280, 48244, 31922, 33564, 33545, 31323, 37424, 25909, 27857)
2. Next we will calculate the difference between np and p. Since we wish to show that there is an in increase in posting over not posting, we will subtract not posting from posting. In such an instance, the researcher will hope to see posivite value for the difference, as positive values strengthen her hypothesis.
> diff = p - np
> diff
 [1] -1373 -4920 -6589  2556   636  1680  6592 -7975 14481  6984
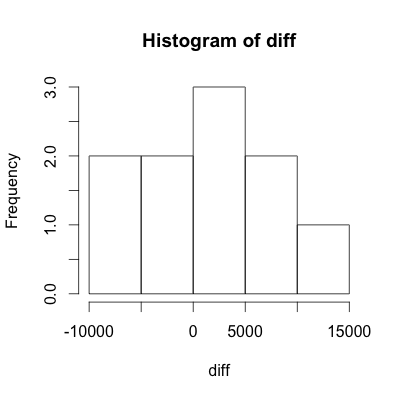
3. Next we need to check the normality assumption of our diff data to ensure our subsequent conclusions are valid. To do this we will construct both a histogram and normal probability plot.
# Construct histogram
hist(diff)

# Construct Normal Probability Plot
qqnorm(diff)
qqline(diff)
 |
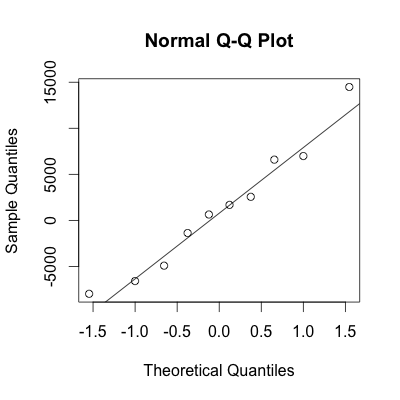 |
Conclusion: Based on the histogram and the normal probability plot, we may assume that the data is approximately normal.
4. At this point, to calculate the test statistic and p-value, two methods can be used. Both give the same answers, so choose the method that you prefer, or that your teacher suggests.
Important Note: If just summary statistics are given, one must use Solution 1. The t.test() function only works with data sets and does not work with just summary statistics.
4.1 Begin by calculating the test statistics.
> # Calculate statistics of diff
> m = mean(diff)
> s = sd(diff)
>
> # Calculate the standard deviation of the statistic
> sd = s/sqrt(n)
>
> # Calculate test statistic
> t = (m-0)/sd
> t
[1] 0.5521451
4.2 Once the t, the test statistic has been caclulated, find the p-value using the pt() function.
> # Calculate the p-value
> pt(t, n-1, lower.tail = FALSE)
[1] 0.2971463
4.1 Simply use t.test() function to calculate the p-value. For more details using the t.test() function, click on the "Additional t.test Help" tab.
> t.test(p, np,
+        paired = TRUE,
+        alternative = "greater")

	Paired t-test

data:  p and np
t = 0.5521, df = 9, p-value = 0.2971
alternative hypothesis: true difference in means is greater than 0
95 percent confidence interval:
 -2800.685       Inf
sample estimates:
mean of the differences
                 1207.2
1. paired = TRUE
First, when using paired data, make sure to define "paired = TRUE" as shown below:
t.test(x, y, paired = TRUE)
2. Variable Order
Second, it's very important to point out that t.test(x, y, paired = TRUE) is different from t.test(y, x, paired = TRUE).
| diff = x - y | diff = x - y |
|
If you have two variables, x and y, and wish to calculate the difference as x - y, use the code below:
|
If you have two variables, x and y, and wish to calculate the difference as y - x, use the code below:
|
3. Left, Right, or Two-Sided Test
Use the following chart to correctly define the alternative parameter depending on the test you wish to run.
|
Ho: μdiff = 0 Ha: μdiff < 0 |
Ho: μdiff = 0 Ha: μdiff ≠ 0 |
Ho: μdiff = 0 Ha: μdiff > 0 |
|
When conducting a left sided test, use the following R code:
|
When conducting a two sided test, use the following R code:
|
When conducting a right sided test, use the following R code:
|
5. Conclusion: Based on the p-value of 0.2971, we fail to reject the null hypothesis. The data fails to support the alternative claim that posting data on social media improves the number of steps taken by individuals.

This work is licensed under a Creative Commons Attribution-NonCommercial-ShareAlike 4.0 International License.