R: Multiple Plot Layout
I. Overview
Often, one may need to combine multiple plots. To do this
II. par(mfrow = c(rows, cols))
We will construct a stem-and-leaf graph of the dist variable from the cars dataset. The following code gives us a chance to see the first 6 rows of the
# view first 6 rows of airquality dataset
head(airquality)

#
attach(airquality)
We will construct a stem-and-leaf graph of the dist variable from the cars dataset. The following code gives us a chance to see the first 6 rows of the
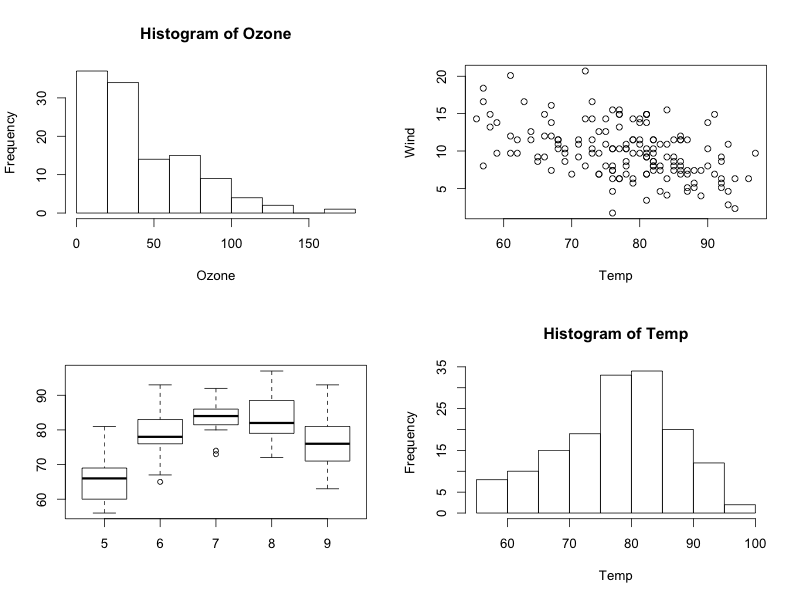
# create 4 plots at once - 2 rows with 2 columns
par(mfrow=c(2,2))
hist(Ozone)               # top left plot
plot(Wind~Temp)           # top right plot
boxplot(Temp~Month)       # bottom left plot
hist(Temp)                # bottom right plot

This work is licensed under a Creative Commons Attribution-NonCommercial-ShareAlike 4.0 International License.