R: 1 Sample Mean - σ
A health researcher wishes to prove that high school students in Cleveland, Ohio sleep less than the recommended 8 hours per night. To prove her hypothesis, she randomly surveys 12 local high school students in the city. The data is listed below.
Solution - part a
1. We will begin by defining the null and alternative hypthesis.
Ho: μ = 8 hours
Ha: μ < 8 hours
2. Next will enter the data into R, calculate sample size, and check the condition of normality by constructing a histogram and a normal probability plot.
> # Calculate the sample mean
> x.bar = mean(x)
> x.bar
[1] 7.783333
>
> # Calculate the standard error
> se = 0.7/sqrt(n)
> se
[1] 0.2020726
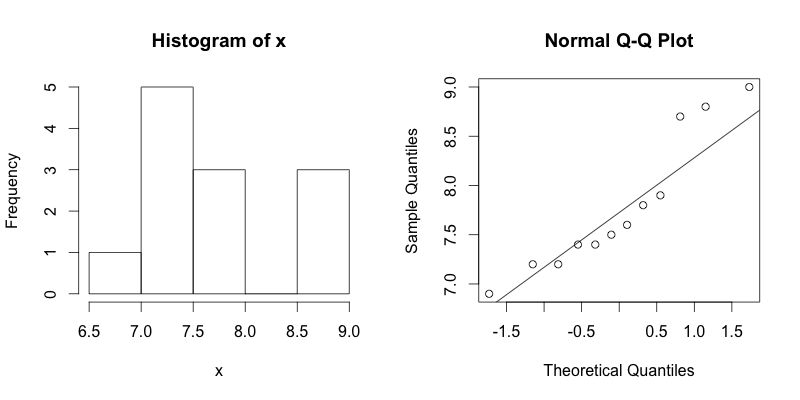
Conclusion: Given the small sample size, and the fact that there are no extreme outliers, we will conclude that the data is drawn from a population that is normally distributed.
3. Next we will calculate the mean and standard error:
> # Calculate statistics of data
> x.bar = mean(x)
> x.bar
[1] 7.783333
>
> # Calculate the standard error
> se = 0.7/sqrt(24)
> se
[1] 0.1428869
4. Next we will calculate the test statistic using the following formula:
\(z=\frac{\overline{x}\,-\,\mu_0}{\frac{\sigma}{\sqrt{n}}}\)
> # Calculate the test statistic
> z = (x.bar - 8)/se
> z
[1] -1.072222
5. Finally, this is a left sided test, so we will use the following R code to find the p-value associated with a z of -1.072.
> # Calculate the p-value
> p.value = pnorm(z)
> p.value
[1] 0.1418102
Conclusion: Based on our analysis, we calculated a p-value of 0.14. Therefore, we fail to reject the null hypothesis as 0.14 is greater than 0.05. The data fails to support the claim that high school students in Cleveland sleep less than 8 hours.
Solution - part b
1. To calculate a 99% confidence interval, first start by completing steps #1 - #3 above. We will be using the following formula to calculate our confidence interval.
\(\overline{x} \pm z^{*} \frac{\sigma}{\sqrt{n}}\)
2. Once steps #1 - #3 from above are completed, we can then calculate z* and the margin of error as shown below:
> # Calculate z* for 99% confidence interval
> z.star = qnorm(0.995)
> z.star
[1] 2.575829
>
> # Calculate the margin of error
> me = z.star*(se)
> me
[1] 0.5205045
3. Now that the margin of error has been calculated. We can simply calculate the lower an upper limits of our 99% confidence interval.
> # calculate the lower limit
> x.bar - me
[1] 7.262829
>
> # calculate the upper limit
> x.bar + me
[1] 8.303838
Conclusion: One can be 99 percent confident that the mean number of hours high school students sleep in Cleveland, Ohio is between 7.26 and 8.30 hours.

This work is licensed under a Creative Commons Attribution-NonCommercial-ShareAlike 4.0 International License.