Residuals & Residual Plots
Introduction to Residuals
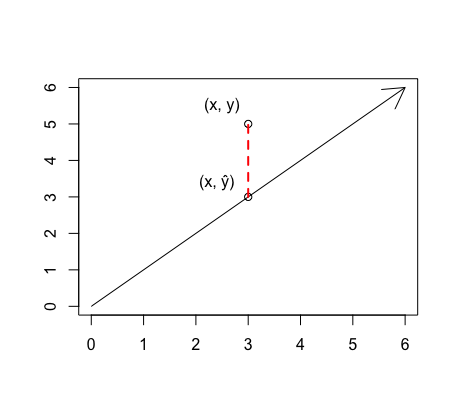
Oftentimes, statisticians want to create a linear model for a scatterplot of data points. This line is called the LSRL, or least squares regression line. Residuals exist because the LSRL does not match perfectly with each point, even though this is the best-fitting line for the given data. The residual is the difference between the value which is observed (\(y\)) and the value which is predicted by the least squares regression line (\(\widehat{y}\)). If the line did go through a given point, its residual would be zero.
*For more information on the LSRL, see the page on Linear Regression.
Important Facts about Residuals:
- residual = \(y - \widehat{y}\)
- The sum of the residuals is equal to zero.
- The mean of the residuals is equal to zero.
Standard Deviation of Residuals
When one wishes to find the standard deviation of the residuals, one uses the following formula (where \(n\) is the number of points/residuals):
Residual Plots
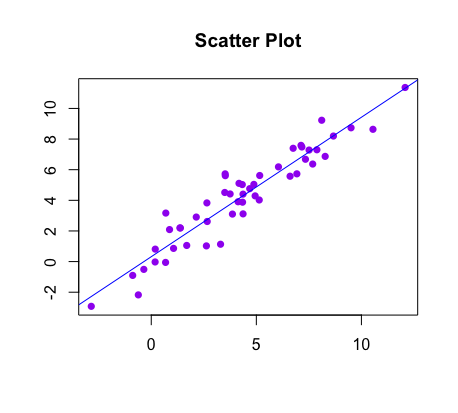
When statisticians want to assess the fit of the model, they often use residual plots. The images below compare a scatterplot with its best fit line to the corresponding residual plot:
 |
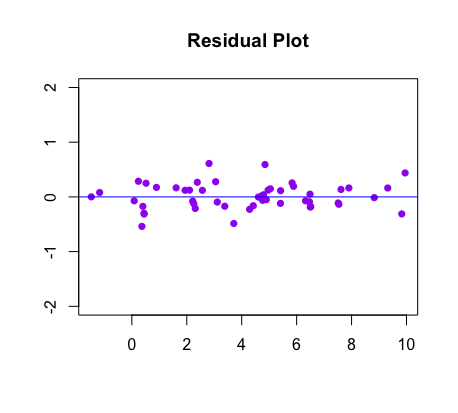 |
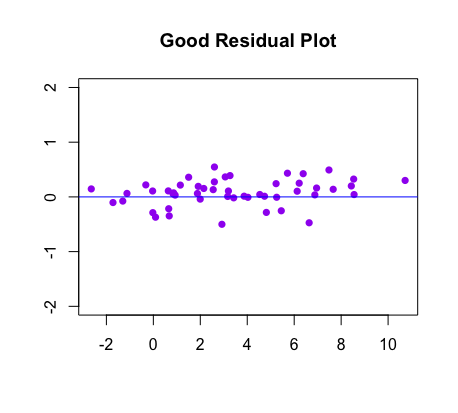
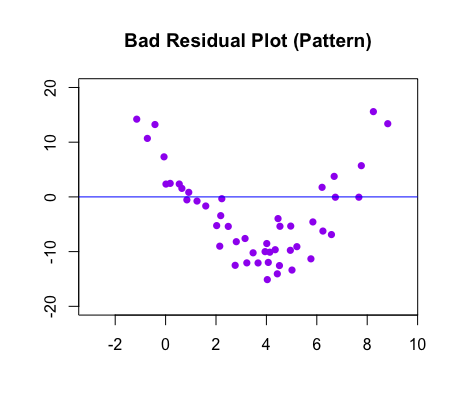
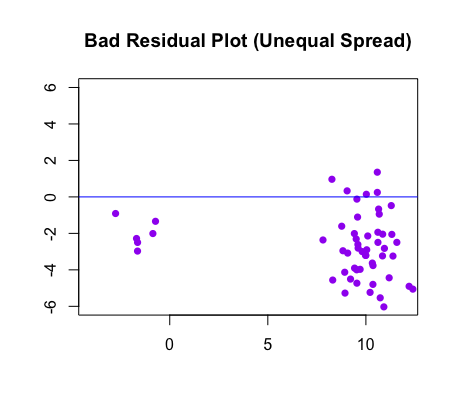
This diagnostic tool tells you what the spread of residuals is like. Ideally, the residuals are spread equally above and below the horizontal line, as shown in the images below.
 |
|
 |
 |