Scatterplots
Introduction
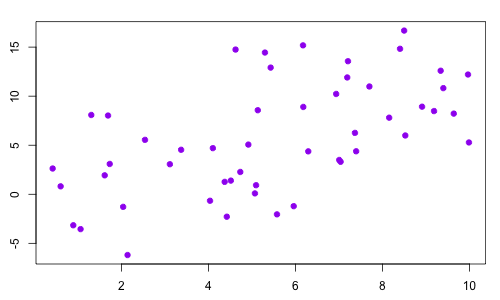
Scatterplots are graphs that display bivariate data as a collection of points. The response variable is on the y-axis and the explanatory variable is on the x-axis.
Describing Scatterplots
To describe a scatterplot, one must address four features: direction, form, strength, and outliers.
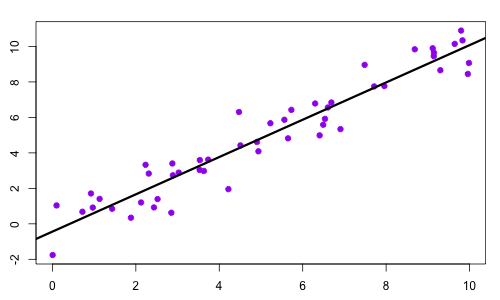
1. Direction: Positive, negative, or zero association?
|
Positive
|
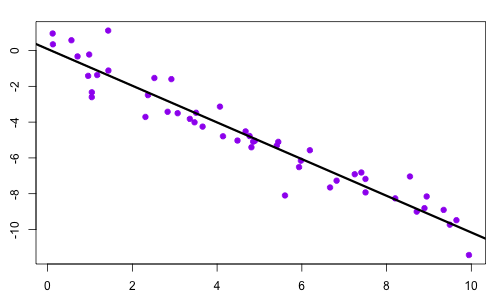
Negative
|
|
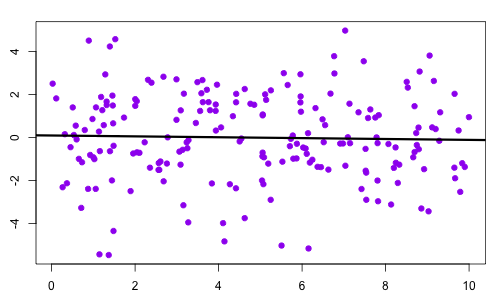
Zero / No Association
|
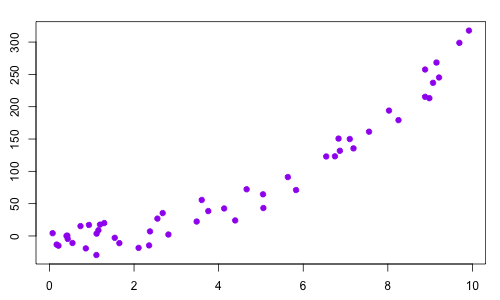
2. Form: Linear or non-linear relationship?
|
Linear
|
Non-linear
|
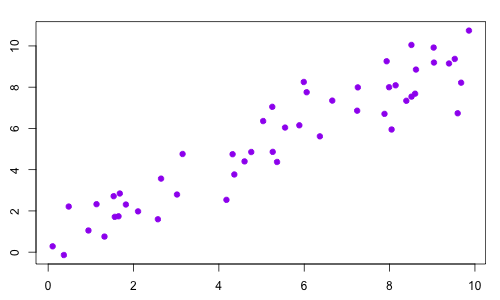
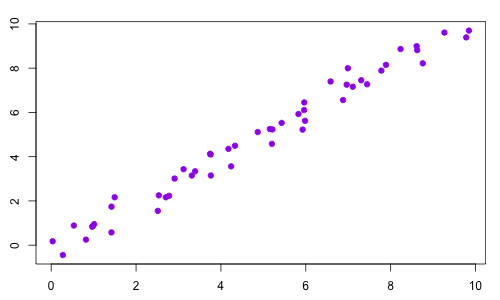
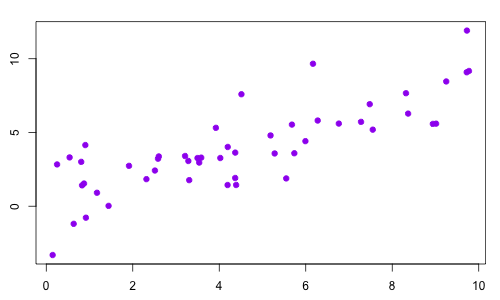
3. Strength: Strong, moderate, or weak association?
|
Strong
|
Moderate
|
|
Weak
|
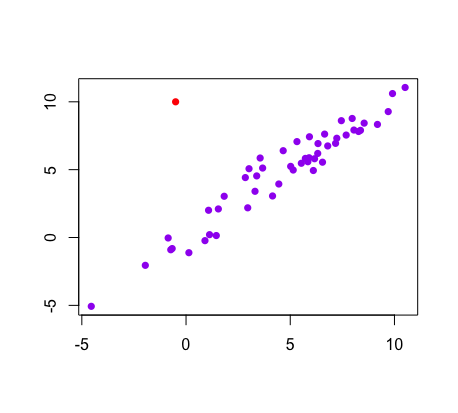
4. Outliers: Any extrema?